You may generate charts, alter technical indicators, and examine financial assets using the TradingView tool. Millions of traders utilize these patterns, lines, and shapes as indicators every day. TradingView is totally browser-based, with no need to download a client. If you’d rather use a mobile device, you can also download an app for iOS and Android.
Since its 2011 debut in Westerville, Ohio, TradingView has grown to have a sizable user base, with eight million accounts being established only in 2020. With either a free or premium subscription, users may chart and analyze a variety of equities, commodities, and digital currencies like Bitcoin. After developing methods and templates, you may share your research with the public. You may improve your abilities in this way by getting suggestions from other TradingView users.
TradingView, is available for free to anybody. Additionally, there are premium memberships that let you examine more charts and indicators at once. A free account with one chart and three indicators is a fantastic place to start for novices.
What social network does TradingView use?
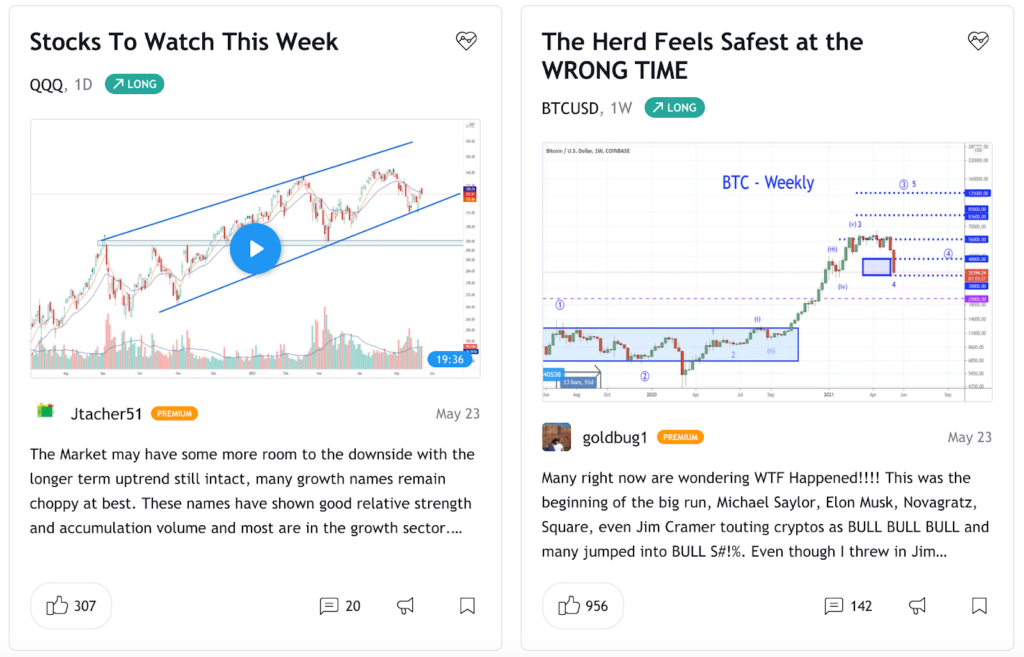
For sharing and showcasing trading ideas, TradingView offers Instagram-like functionality. You get an opportunity to learn new things or acquire opinions by visiting the Ideas and Streams pages on the website. You may get graphs, movies, and user comments by going to the Ideas page. Members of the community can participate in debates and chat rooms. However, keep in mind that anybody may produce and distribute ideas, so exercise caution. You shouldn’t interpret this as financial advise because every trader has a unique style and approach.
TradingView Streams allow you to watch other traders build charts in real-time, much like you may do when you watch a Twitch stream of your preferred gamer. Although it’s a nice supplementary feature, it’s still in beta, and there isn’t much material.
Getting to know the TradingView UI
TradingView may seem a little perplexing if you’ve never used charting software before. Let’s first simplify things a little.
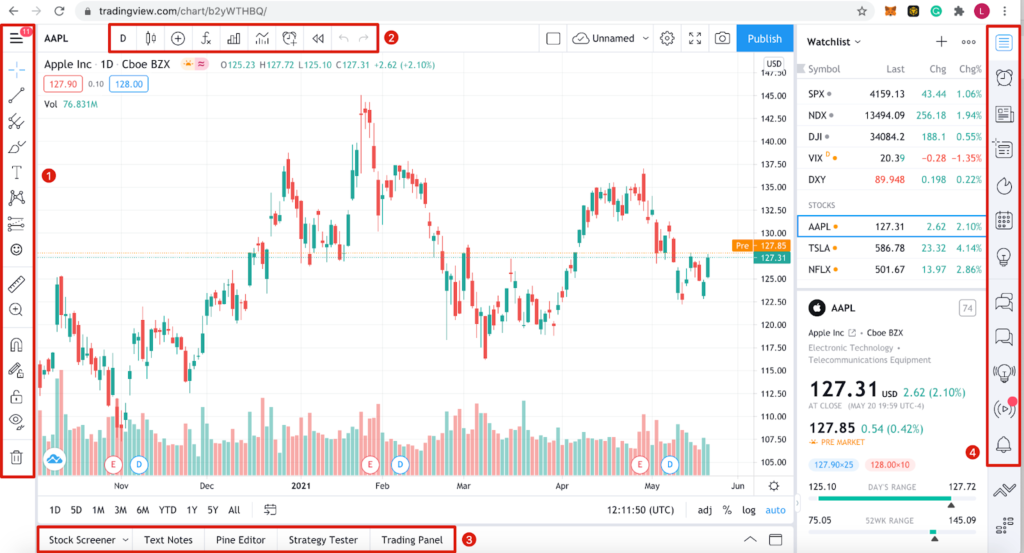
Toolbar 1
All of the charting and sketching tools that may be used right in the chart area are contained in this toolbar. There are many possibilities to explore, from basic lines to long/short positions. Each tool has a right-click menu that shows an expanded options. Although some are more complicated than others, the standard lineup has enough fundamentals to get you going.
Toolbar 2
Here are some options for altering the chart’s appearance. Candlesticks, line graphs, area graphs, and more types of graphs are available. To the left, there is a search box that may be used to modify the displayed asset. The [Indicators & Strategies] button, which may be used to enter readymade analytical patterns like a moving average, is another useful tool.
Toolbar 3
Despite not providing a brokerage service, TradingView’s website does allow trading through the [Trading Panel] option. If you already have an open account with any of the partners on the list, you can swap with them. Using [Strategy Tester], you may backtest your tactics as well.
Toolbar 4
News and TradingView’s social features are the major topics of this section. You can edit your watchlist, send users private messages, explore Ideas and Streams, and have access to a customized calendar. This is the place to go if you need to locate any data, listings, or information.
Altering the charts in TradingView
Regarding chart design, everyone has their own tastes. Making your graphs more unique in terms of colors, lines, and axes facilitates rapid reading and comprehension. By selecting [Settings…] when you right-click the graph area, you may get all the settings you require.
From the [Settings…] menu, you can also reset your chart if it becomes cluttered and create personalized email price notifications.
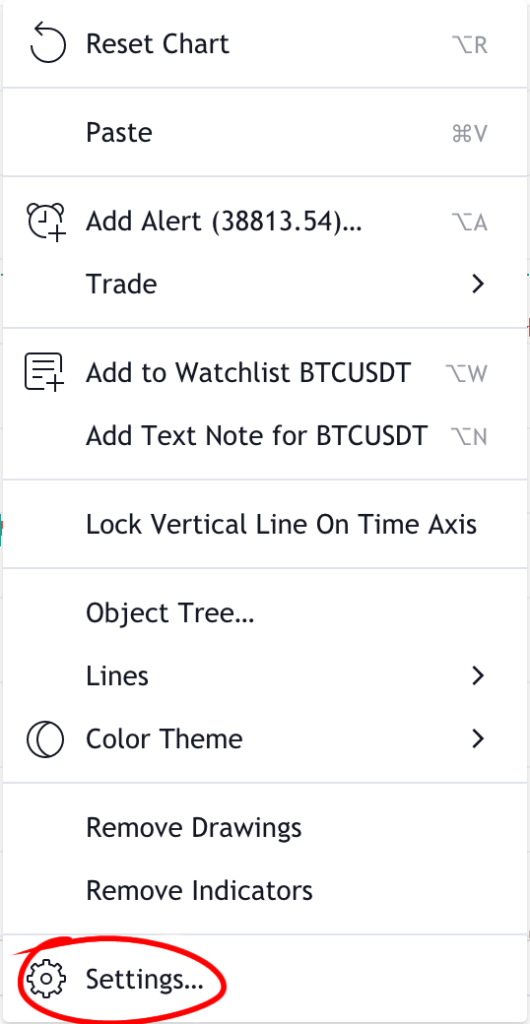
After selecting [Settings…], you will be sent to the [Chart settings] page where you may experiment with a number of choices. Let’s briefly go through the fundamentals.
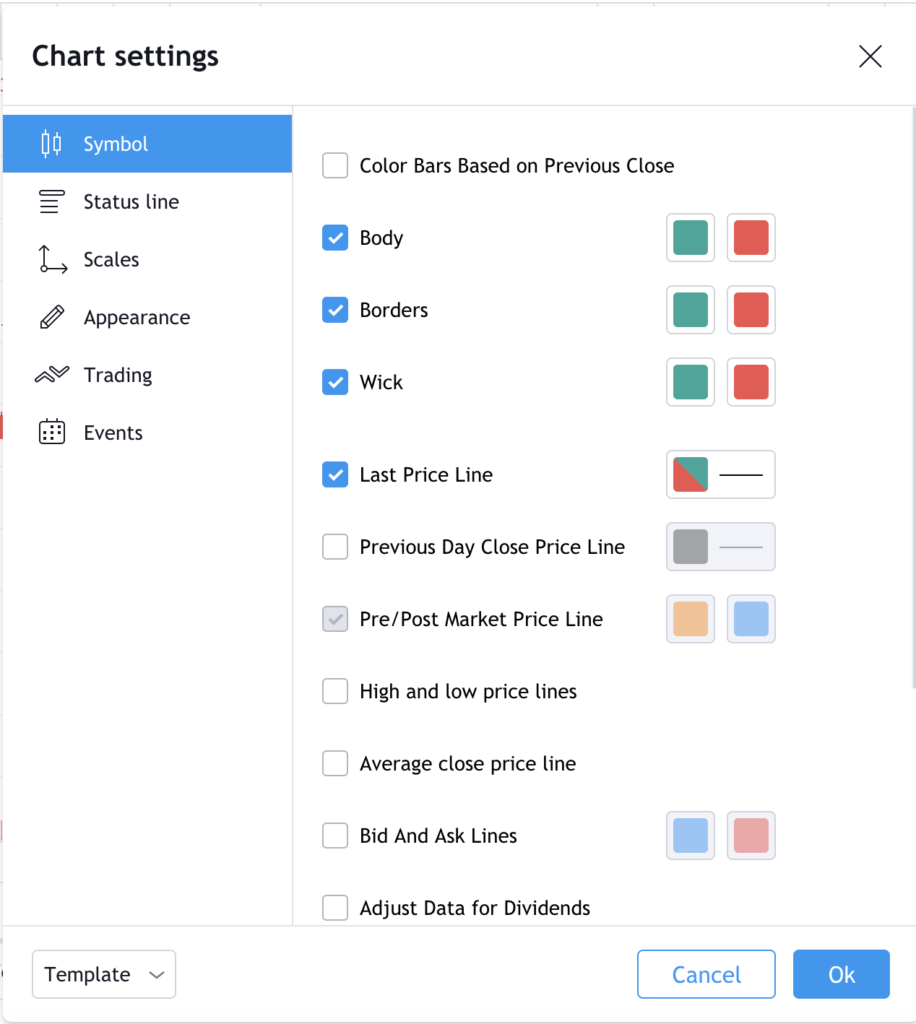
- You may modify the appearance of your candlestick charts with [Symbol]. You may color-code each component of the candlestick pattern whichever you desire.
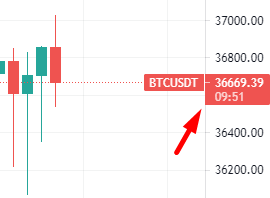
- The [Status line] provides choices for modifying the data that may be shown in the chart’s upper left corner, including OHLC (open, high, low, and closing prices) information and buy and sell buttons. The blue box displays the highest offer, and the red box displays the lowest ask price (38,345.96). (38,345.97). You have the bid-ask spread in between (0.01).
- The trackers you can see on the right-hand axis may be changed using the choices provided by [Scales]. You may, for instance, include the day’s high and low pricing or the time remaining before bar closing.
- You may customize your grid lines, background color, axes, and other visual elements with [Appearance].
- If you are connected into a broker account, [trading] gives you the option to alter graphic components.
- You may choose to display dividends, splits, and other events on the chart area using [Events].
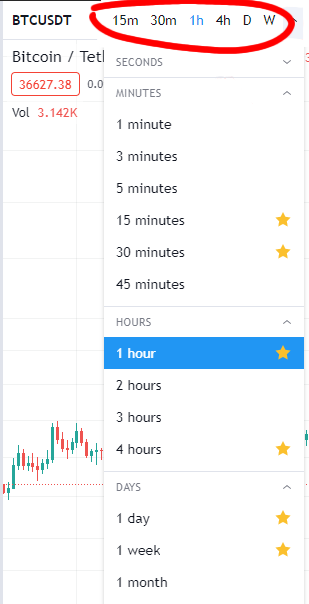
You could wish to modify the intervals of your candlesticks or other symbols along with configuring the chart display. Go to the top bar and select the far-left button to accomplish this. A lengthy list of various intervals, spanning from seconds to months, is now available. Some intervals can be marked as favorites so that they appear on your top bar.
There is no need to manually save your chart after you begin tweaking it. You may log out and return to your edits later since TradingView stores all of your changes in real-time.
The benefits and drawbacks of TradingView
When it comes to asset screeners, TradingView is simply one option among many others. The majority provide a comparable collection of charting and trading tools, but let’s examine the key features first. Although TradingView excels in several areas, there is still potential for growth.
Benefits:
- HTML5 charting – TradingView is accessible from any device with an internet browser. You may view your charts anywhere and don’t need to install any software.
- Everyone has access to the bulk of services without paying a membership fee.
- Server-side alerting system: If you set an alert, TradingView’s servers will monitor it. Receiving alert alerts does not require TradingView to be active.
- Compatibility with Binance – TradingView can be used in the trading UI on Binance, even if you can’t access Binance via TradingView’s website. With Binance, you can quickly purchase, sell, and make charts on the go.
- Advanced users can construct custom indicators and save them to TradingView’s servers using scripts. Pine Script, a straightforward bespoke scripting language created by TradingView, powers this functionality.
- The amount of stocks, securities, commodities, and FX data that can be charted is significant. This is not just about cryptocurrency, either!
- Backtesting: Using the built-in functionality is straightforward after you’ve devised a plan.
Cons
- Community problems: The Streams and Ideas tab concept is intriguing, however the content’s quality fluctuates widely. Many pieces of advise are quite speculative and of little benefit to first-time users. There is occasionally trolling in the comment area as well.
- Customer service – The TradingView community frequently complains about issues with the company’s customer service. Issues may only be reported by paying customers, and help is unavailable to free users.
- Integration of brokers and trading platforms has been done by TradingView, however the alternatives are still very restricted.
- Prices for U.S. equities in Cboe BZX data – TradingView do not originate from the corresponding stock markets. For instance, the Cboe BZX exchange provides the price for NASDAQ equities, which might be a little off from the actual price. There is a charge for access to real-time data from an exchange.
TradingView is a good choice to investigate for anyone seeking for a free solution with lots of useful capabilities. Additionally free to access, their training materials thoroughly go over the fundamentals of charting and technical indicators.
However, the social component isn’t as powerful. You should disregard the speculative counsel that is frequently given in chat rooms. Because you have to sort through good and poor advise, this element makes the social parts less beneficial for beginners.
However, TradingView is a fantastic tool for backtesting trading techniques and is worth trying just for its charting features. With just a free account, you’ll have more than enough to learn about the complex subject of technical analysis.


